How do I explain this thing?
For almost 2 decades I’ve struggled to draw an analogy to the data management space. However, data is its own animal, it has unique quirks like the ability to be copied almost perfectly. And you can move data at speeds that draw no parallel to things we can observe. So there really aren’t great analogies that you can consistently draw from in order to help people justify their investments in it. So when I had this ah-ha moment, I couldn’t hold back writing a white paper about it.
Data as Plastic?
Plastic certainly isn't something that often gets attributed to data, but bear with me. A couple weeks ago I was introduced to the recycled plastic pellet manufacturing process. If you've never seen these little pellets they almost look like grains of sushi rice. They act as raw materials for all sorts of plastic applications. Watching their manufacturing process got me thinking about data. And I've come to the conclusion that it's a great analogy to data. In the end, data is just a raw material just like these plastic pellets.

The Loading Dock
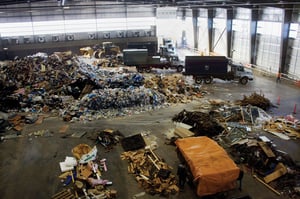
To centralize all the collections of plastic the recycling plant has a giant loading dock. The plastic comes from thousands of homes and businesses so the dock allows for all the plastics to be centralized. As you could imagine, there are a lot of things in the piles of rubbish that aren’t plastic. So to get to that plastic a significant sorting and cleansing process must be undertaken.
Parody- Data Lake

This giant loading dock is just like a Data Lake. In a Data Lake, we’re favoring openness over orderliness, to ensure we centralize all the data assets in one place. Without a data lake, organizations have to rely on one off data extracts from individual source systems. This isn’t such a bad thing if you only have one source of data. But if you live in an organization that has hundreds of source systems, there’s no way to live without some type of centralized data store like the data lake. Just like the dock, the data lake has many impurities and still requires significant sorting and cleansing work before the data can be scalably used across the organization. Again this is because we favor openness to orderliness to ensure we get ALL the data assets, without roadblocks.
Sorting and Cleansing the Plastic
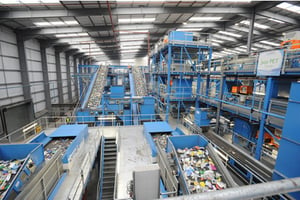
To scalably repurpose the plastic, the recycling plant has to take the rubbish in the loading dock and categorize it. This is done through a labyrinth of machines connected by conveyors which eliminate all the rubber, metal, organic material, paper, etc.

Once the plastics have been sorted they undergo a cleansing process to rid them of impurities. If these impurities don’t go addressed, they can cause structural deficiencies for whatever gets built them.

Additionally, in the production of plastics, particularly recycled plastics, they have these giant sorting machines that segregate the plastic into colors. Getting these colors to converge is tricky and requires some sophisticated automation. As you could imagine, if downstream plastic pellet colors somehow got mixed they wouldn’t represent their desired color well.
Parody- Master Data Management
The Sorting and Cleansing process is just like the process we go through to cleanse and master corporate data. For example, the records about your customers which are piled in your data lake need 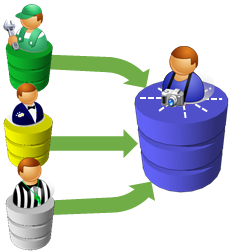 to be identified and sorted from the pile of rubbish. Additionally, this data needs to be brought together so that you’re merging the same customer that might appear in a handful of your different data systems.
  Yes it is true that all those customer interactions are in the data lake, but merely saying that doesn’t mean you’ve uniquely identified each customer and all their varied interactions with your organization. Additionally, each representation of your customer interaction might appear with different variations, like Bill Gates, William Gates, Bill G., and W. Gates. All these iterations might be the same person, to determine this we need sophisticated software for data just like the recycling plant has machinery for plastic.
Parody- Data Quality

Just like the recycling plant, we also have to run a cleansing process. If we skip this process then the analytics can get incorrect aggregations, filters, parameters, etc. Data cleansing fixes anomalies that occur in data, like a US zip code with letters in it, or a phone numbers with non standardized formats. In data we tend to cleanse the data before we run it through the master data management system because the sorting works more reliably when we don’t have to work around formatting anomalies.
Turning Plastic Into Something Useful

Ultimately people want to do something with those plastic pellets, like build parts and toys . Building these things by yourself requires you to take up the task of cleansing, sorting, and molding plastic to conform to the object you're trying to make. Let's say in this case you want to make a toy car.
 If you're doing it from scratch you can control every step in the molding process, but it takes a serious amount of time and individual experimentation. But what if we had hundreds of people, working for the same company which were individually cleansing, sorting, and molding their own toy car? There would certainly be a lot of variation between every person molding their own objects.
 So clearly this isn't cost-effective, scalable, or a consistently repeatable way of building things. To get there, we need to have a system and framework to ensure that we get similar results with the same raw plastics.
Innovative approaches have now emerged for highly technical workers to create objects from plastic. These workers are using 3D printers. While the printers require a lot of time and work getting their print just right, the results are impressive!

Parody- Self Service Analytics
The plastic car example is a direct analogy to self service analytic approaches. Out of necessity, discovery, distrust, or habit, analysts will often take it upon themselves to reach into the data lake and rummage through all the data. They’ll go through the sorting, cleansing, and molding for their own analytics. Over the last 5 years we’ve seen excellent tools get introduced to service the needs of these analysts, so these lone wolfs don’t have to live in “Excel Hell”.
I speak somewhat critically about this, but there is a place for this open type of exploring within organizations; allowing for questions to be asked which haven’t been asked before, which may lie outside the orderliness of current processes. However, organizations which try to scale their analytics teams by leveraging the “Lone-Wolf Analyst Architecture” find themselves with a vexing challenge... Too many versions of the truth. Leadership of these companies are often unable to agree on fundamental measures and attributes, because everybody has their own slant on the data integration, cleansing, and business logic. Just like asking people to mold their own plastic cars from scratch, you’re going to get a lot of variation in the end result. This is the case even 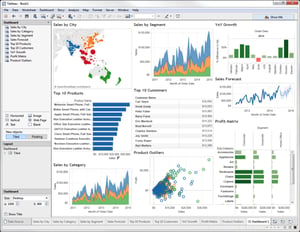 with expensive self service in-memory tools, because gathering and conforming data ends up being a task owned by individuals.
So while there is a place for self service in-memory analytics, it really belongs in the realm of open discovery and not in the realm of scalable information dissemination. And just like our 3D printer, the results can be impressive, but the end results are still based on individual interpretation and technical expertise. You could argue that this would be the case with any BI roll out, but this is why designing for scale and simplicity as a team effort becomes a worthwhile venture for organizations to embark on. Rather than embedding this technical expertise into a BI tool that has a proprietary in-memory structure, we drive reusability and simplicity into a database which is open to ANY BI tool.
Scaling Reusability and Simplicity

To scale this process of building our toy car we need components that can easily come together to form the car, like Legos. With Legos I get a consistent and conformed component that I can use to combine with other conformed components to build anything I want, including the toy car.

And this is something I can roll out and scale to mass audiences, because it makes building things fast, reusable, with a flattened learning curve.
Perhaps more importantly, the conformed components are something that can be reused to build other objects like spaceships, planes, and houses.
Parody- The Data Warehouse
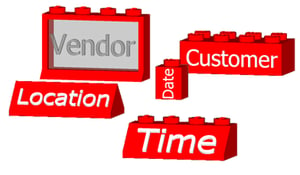
To scale the analytics architecture we need “data building blocks” which are consistent and allow mass quantities of people to engage in getting data. The data warehouse conforms the data into these data building blocks which are easy to query and represent data from across sources.
Data Warehouses are agnostic to what is on the receiving end of the query, thus I can service a wide array of BI consumers. THIS is why organizations are willing to invest in them. They are investing in a foundation which will service analyitcs irrespective of what BI tool gets used. Additionally, because the Data Warehouse is modeled for analytics, the SQL Query is likely just a handful of lines long, vs the multi-page queries you might have to generate against a data lake. Another speed advantage is the runtime itself.  In a Data Warehouse the data is conformed into a star schema. Combine this schema with cloud MPP capabilities, and the Data Warehouse performs fast enough to eliminate the need for in-memory layers completely.
Building Instructions
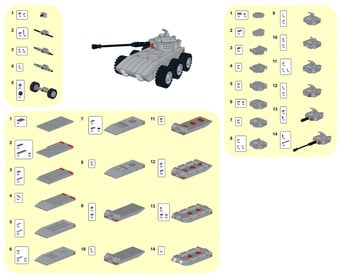
Nearly every lego set comes with some kind of thing to build. And they’ll usually come with instructions on how to assemble the parts to make that thing. Now this one is a bit of a stretch (remember I’m trying to compare this to data) but imagine the instructions could automagically assemble an entire page of components into finished parts. This would certainly make building stuff much faster.

Unlike the villain on the Lego movie we don’t want to glue these parts permanently together because we will want to use them for other purposes at a later point.
Parody- BI Metadata Layer
Business Intelligence solutions have to address a mature problem. This isn’t a problem that comes up in a BI demo, but down the road it has to be addressed. It goes something like this:
- I have 1000 analytics and dashboards created
- I have some business logic that has changed, and it must be reflected in all the existing analytics and dashboards
- How do I ensure that the business logic change is propagated to all the analytics and dashboards

In-memory analytic vendors certainly have the ability to address this problem because all the data is stored in an in-memory structure. But this means that I’m creating yet another layer of stored data. Also it means that I’m storing a finished in-memory set like gluing together lego components. So how do I get the ability to control my content without committing everything to memory?... BI Metadata
 See a BI Metadata Layer decouples the query from the visualization. Meaning, if the body of queries needs to change I can do so once in the Metadata Layer, and all the associated analytics using that layer get updated. Essentially the BI Metadata Layer is a SQL assembler. Every time I select “Cost of Good Sold” or “Sell by Date” or “Region” it assembles the SQL query required to produce that data. BI Metadata Layers are the perfect companion to a Data Warehouse. They allow the warehouse to hold the “lego components” while it issues out the “instructions” for those components which the user wants. And it does this without committing the results to a strict in-memory structure. (gluing the legos together) Additionally BI Metadata Layers can scale like crazy because they aren’t moving gobs of data. This is because they take the query to the data and not the data to the query.
Data as Plastic
I’ve struggled with a way of describing the nuanced behaviors of data. I feel plastic pellets come about as close to a physical analogy as I can muster. There are certainly other analogies that I’ve toyed with, but none encapsulate the justification for each of the components in a modern data management backbone. More importantly, understanding the nature of data can help us understand the complex problems that need to be solved in order to make it useful.
To this day, we still find executives that will say, “Why do we even have to move the data? Why can’t we just leave it where it is?” or “Isn’t there just a software tool that will do all this by itself?” These kinds of comments are telltale signs that the nature of data is simply not understood. Perhaps someday when we’re able to use our Star Trek Replicators, data will be just that easy to work with. We’ll get there, but we’re not there yet.

Who is Intricity?
Intricity is a specialized selection of over 100 Data Management Professionals, with offices located across the USA and Headquarters in New York City. Our team of experts has implemented in a variety of Industries including, Healthcare, Insurance, Manufacturing, Financial Services, Media, Pharmaceutical, Retail, and others. Intricity is uniquely positioned as a partner to the business that deeply understands what makes the data tick. This joint knowledge and acumen has positioned Intricity to beat out its Big 4 competitors time and time again. Intricity’s area of expertise spans the entirety of the information lifecycle. This means when you’re problem involves data; Intricity will be a trusted partner. Intricity's services cover a broad range of data-to-information engineering needs:
What Makes Intricity Different?
While Intricity conducts highly intricate and complex data management projects, Intricity is first a foremost a Business User Centric consulting company. Our internal slogan is to Simplify Complexity. This means that we take complex data management challenges and not only make them understandable to the business but also make them easier to operate. Intricity does this through using tools and techniques that are familiar to business people but adapted for IT content.
Thought Leadership
Intricity authors a highly sought after Data Management Video Series targeted towards Business Stakeholders at https://www.intricity.com/videos. These videos are used in universities across the world. Here is a small set of universities leveraging Intricity’s videos as a teaching tool:

Talk With a Specialist
If you would like to talk with an Intricity Specialist about your particular scenario, don’t hesitate to reach out to us. You can write us an email: specialist@intricity.com
(C) 2023 by Intricity, LLC
This content is the sole property of Intricity LLC. No reproduction can be made without Intricity's explicit consent.
Intricity, LLC. 244 Fifth Avenue Suite 2026 New York, NY 10001
Phone: 212.461.1100 • Fax: 212.461.1110 • Website: www.intricity.com
